MATAGORDA
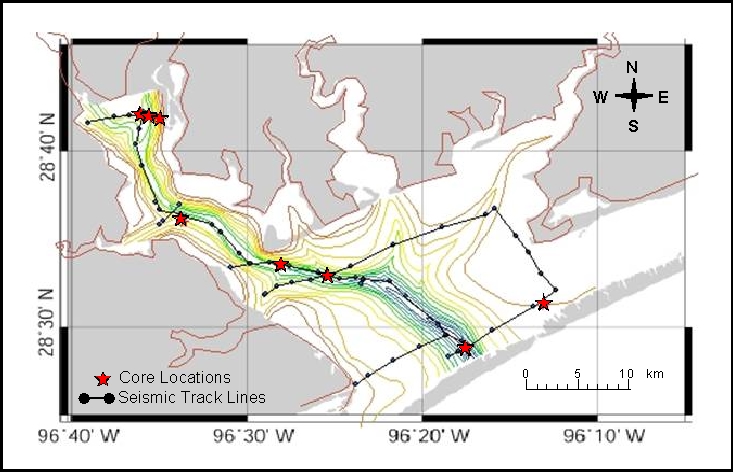
Map of study area illustrating locations of core and seismic data. Contours represent Pleistocene/Holocene contact.
Contour interval is 10 ft and ranges from 20 ft (red) to 140 ft (blue).
Comments, questions? Contact us at
gulf@gulf.rice.edu
.